26 Fitness and Wellness SEO Statistics You Should Know

26 Fitness and Wellness SEO Statistics You Should Know

The numbers in this report reflect something we see consistently with fitness and wellness clients: the gap between businesses investing in organic search and those relying purely on paid channels is widening. Acquisition costs aren’t coming down, and neither is competition. The brands that treat SEO as a long-term revenue system, rather than an afterthought, have a measurable leg up.

  • Local visibility is make or break. The difference between ranking third and fourth in the Local 3-Pack can mean missing 850–900 potential member interactions per month before they even know your business exists
  • Most searches won’t convert immediately, and that’s fine. 70% of queries are informational, so building content that meets users early in their journey is what keeps you front of mind when they’re ready to act
  • Content depth matters more than volume. The figures show that long-form content earns significantly more backlinks than shorter pieces.

For gym owners, supplement brands, and fitness entrepreneurs, knowing the fitness market is worth Billions won’t pay the bills. Visibility is the key factor. Over 90% of consumers use Google to evaluate local businesses before making a decision [7], and the fitness businesses showing up in those results aren’t getting there by accident.

Organic search has become an increasingly important channel as paid acquisition costs continue to rise. The winning strategy is building content with depth, matching it to how audiences search, and treating local visibility as a revenue driver rather than a nice-to-have.

This report pulls together the benchmark data that matters most for fitness SEO and content strategy, from local search behaviour and seasonal trends, to conversion rates and content performance. 

Local SEO statistics for gyms & fitness studios

  • According to industry experts, Local 3-Pack rankings are primarily driven by Google Business Profile optimization (32%), followed by review signals (20%) and on-page signals (15%)[13].
  • Google Business Profile listings in the “Local 3-Pack” receive 93% more actions (calls, clicks, and direction requests) than those ranked in positions 4–10 [10].
  • Roughly 76% of gym members discovered their current facility through local search, proving it to be a more effective discovery tool than social media or traditional ads [11].
  • 76% of “near me” mobile searches result in a physical visit to a business within 24 hours, making mobile visibility a non-negotiable for local studios [12].
  • Increasing your Google Reviews rating by 1 star significantly improves conversion and revenue performance by 44% [14].
  • 85% of potential members are more likely to choose a business that actively responds to reviews, whether they are positive or negative [7].
  • 53% of mobile users will abandon a website if it takes longer than three seconds to load, directly impacting class bookings and lead generation [15].

Why this matters to your gym or studio

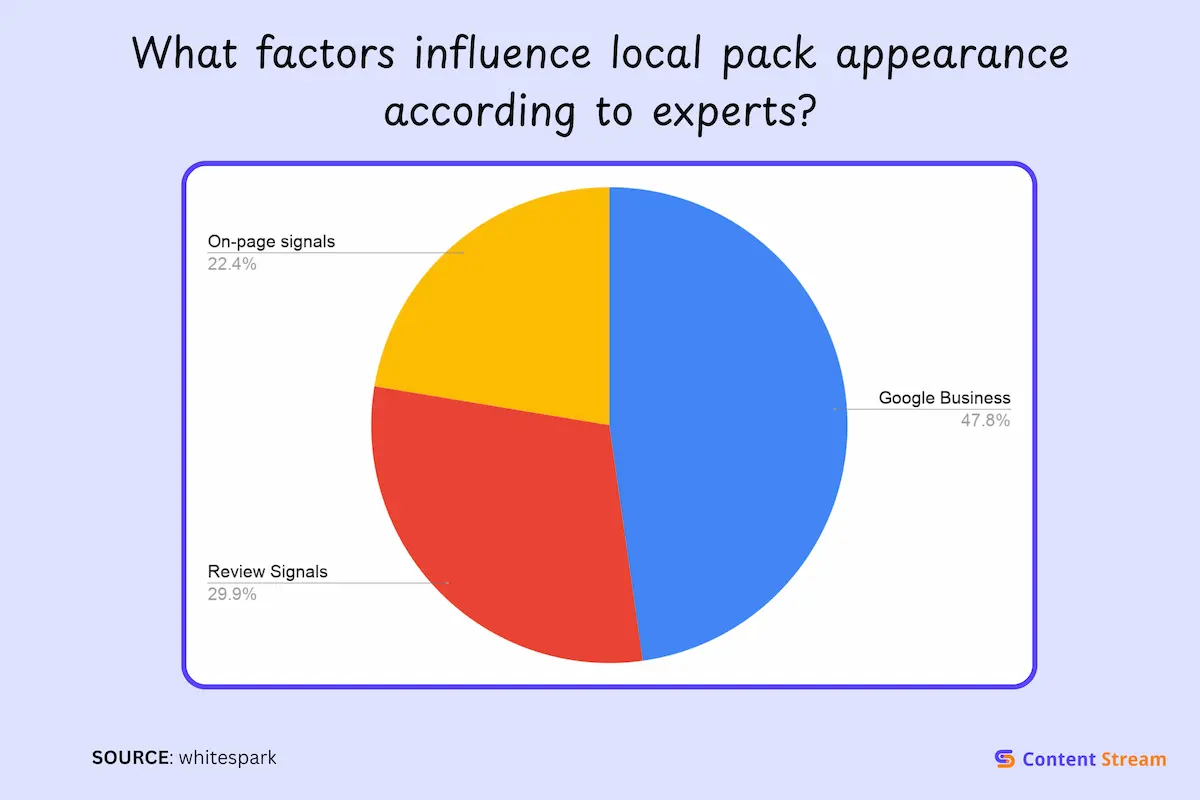
The difference between ranking #3 and #4 in the Local 3-Pack is not subtle; it is the difference between being seen by 93% of searchers or being virtually invisible. 

If your area generates 1,000 “gym near me” searches per month, that fourth-place position means you’re missing out on 850-900 potential member interactions before they even know you exist.

And when 88% of potential members say they’re more likely to choose a business that responds to reviews, your engagement becomes part of your competitive advantage.

Statistics for search intent and seasonality for fitness businesses

  • January is reliably the peak month for gym sign-ups, typically seeing a 20–25% jump compared to December, largely fueled by New Year fitness resolutions [19].
  • About 12% of all new gym sign-ups occur in January as members return to routines after the holidays [20].
  • About 70% of Google searches are informational, meaning users are looking for answers or guidance rather than trying to buy immediately [16].
  • Only 1.7% of searches carry transactional intent, while another 13.2% carry commercial (research/comparison) intent. That means roughly 15% of searches represent users somewhere in the buying journey, making intent targeting critical for SEO and paid campaigns.[17]
  • 92% of organic search traffic comes from long-tail keywords, which are more specific and tend to convert better [18].
  • Fitness facilities often see up to 50% lower attendance during summer months as workouts shift outdoors and travel increases [21].
  • Google trends data shows interest in yoga classes increases up to 70% in summer [22]

Why search intent and seasonality define your SEO authority

Informational queries like “benefits of [product]” won’t drive immediate sales, but they are essential for Top-of-Funnel (ToFu) SEO, establishing your brand as a trusted authority before the user is ready to buy. 

That’s why it’s important to map specific long-tail content to the user’s journey. This way, your content is there for the user when they are investigating, and you remain their top choice when they transition to a transactional “buy” mindset.

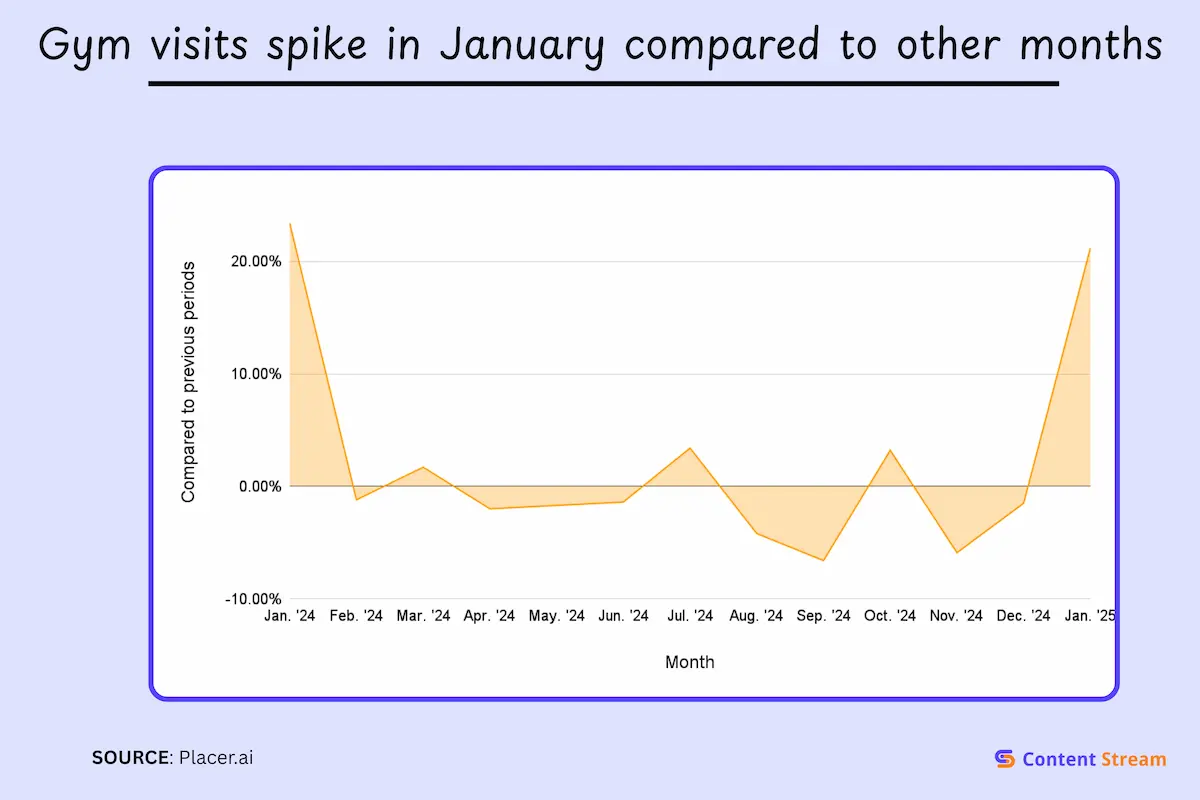
Seasonality also dictates your editorial calendar and content refresh cycles. Since fitness interest peaks in January, a gym’s SEO strategy might involve updating relevant content like “Best Gym” rankings and “New Year Transformation” guides. 

But a fitness saas product will focus on content targeting gyms and studios, in preparation for the increased demand when new members sign up.

Want to know where your SEO stands?Get a Free Audit →

Statistics for content strategy

  • Research indicates that the average word count of Google first page results is approximately 1,447 words [24].
  • Leading data suggests that optimal blog length for traffic and social shares falls between 2,100 and 2,400 words, providing enough room for deep topical authority [25].
  • Long-form content is significantly more shareable with an average of 77.2% more backlinks than short-form pieces [25].
  • 82% of marketers report that video has directly increased dwell time on their websites [26].
  • Including videos in blogs results in engagement rates above 40%, keeping users on the page longer and signaling value to search engines [27].
  • Healthcare websites see 55% higher blog traffic when their content is properly SEO-optimized, highlighting how critical search strategy is for growth. [28]
  • 56% of shoppers use visual search for product discovery, making image optimization critical for fitness ecommerce businesses. [33].
  • 91.8% of all searches are from long-tail keywords [34]

E-commerce conversion rates for fitness brands

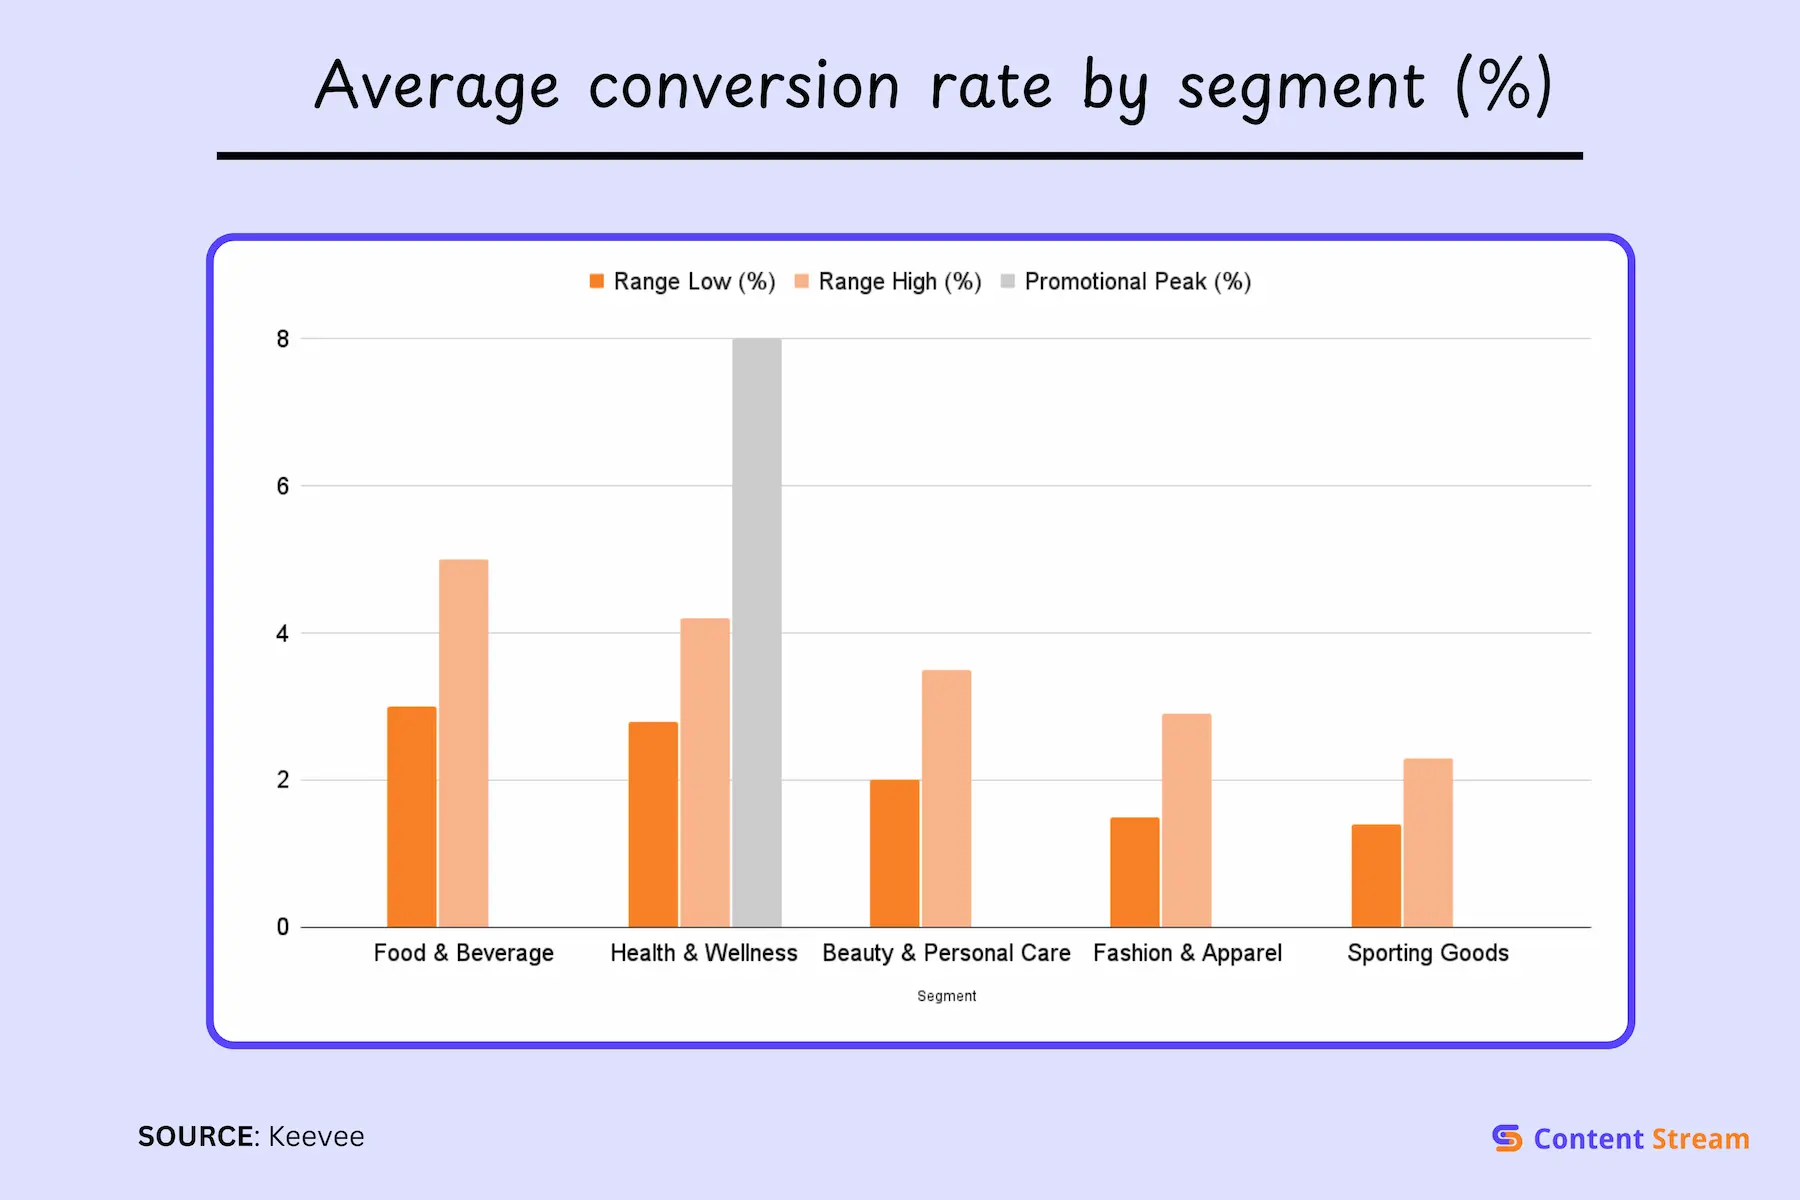
The fitness e-commerce market is showing no signs of slowing down, with segments like online fitness projected to grow at a compound annual rate of nearly 28% [29]. But here is the problem: more traffic does not equal more revenue if your conversion rate is low.

Whether you’re selling supplements, apparel, or equipment, understanding your conversion rates stack up against industry benchmarks is critical. 

Fitness brands e-commerce statistics

  • The average e-commerce conversion rate for health and supplements typically sits between 2.8% and 4.2%, though high-trust brands often push the upper end of that range [30].
  • Fitness apparel brands see slightly lower average conversion rates, around 1.5% to 2.9%, as shoppers often compare multiple styles and sizes before committing [30].
  • When health and fitness brands run aggressive promotions, conversion rates can jump to about 8%, highlighting the industry’s high sensitivity to seasonal offers [31]..
  • The average cost per leads in Google Ads for the health and fitness sector in 2023 was $51.42, $7 lower than the average across all other industries [32].

Conclusion

The 2026 fitness SEO benchmarks make one thing clear. Visibility beats vibes. It doesn’t matter how great your gym looks or how strong your product is if customers cannot find you when they are ready to buy.

Local search dominance brings foot traffic. Conversion optimization determines whether ads scale or bleed cash. Search intent separates profitable keywords from expensive distractions. 

Content depth, video, and real expertise now decide who ranks and who disappears, especially in fitness and health, where Google applies stricter standards [5].

The brands winning in 2026 are not guessing. They are using data, understanding seasonality, and building trust at every touchpoint. They treat SEO as a revenue system, not a side project.

If you want to know where your website stands and where you are losing traffic, leads, or sales, request a free SEO audit today. We will break down exactly what is holding your site back and what to fix first.

Author

matthew iyiola, SEO manager at content stream

Matthew Iyiola

I’m Matthew, a personal trainer turned SEO who’s worked with brands like Gymfluencers, Sailo, ClickCease, and Fraud Blocker. These days, I help small to medium sized companies grow their reach with smart, search-focused content.