
State of Organic Visibility in the Supplement Industry
The US supplement industry is one of the most competitive consumer markets online. Hundreds of brands selling similar products compete for the same keywords, buyers, and online market share. For many of these brands, organic search is one of the few channels where an effective strategy can provide a real competitive and profitable edge.
But what does the execution look like? What strategies work and which ones should be abandoned? And more importantly, how much success can brands actually expect from SEO in the supplement industry?
To find out, we analysed the organic search footprint of 116 US supplement brands, ranging from large retailers to DTC challenger brands and established manufacturers. We looked at domain authority, keyword footprints, content strategy, technical health, and more. The data was pulled from Ahrefs in July 2026.
Here's what we found:
- The top 10 sites capture 58% of all organic traffic in the sample. The top 20 capture 71%. The supplement market is a winner-take-most situation.
- Domain authority is the strongest predictor of organic traffic, followed by backlink volume and referring domains.
- Websites with a bigger keyword footprint gain the most traffic. But having more content only pays off when it's distributed between informational, transactional and commercial queries.
- Sites that lean heavily on informational content see significantly lower traffic per keyword than those with a more mixed intent profile.
- Paid and organic traffic grow together, contrary to the notion that organic traffic can replace paid efforts.
- High branded traffic share isn't always a red flag. It's only a problem when it's driven by weak content performance, not when it's driven by strong brand recognition.
- 404 errors and redirects don't appear to hurt organic performance. Most supplement brands have technical debt in this area, and it doesn't seem to affect their traffic.
- Six brands in our sample get more traffic than their content or backlinks would predict. A likely explanation is their robust offsite presence, mostly social following and influencer partnerships.
- 97% of supplement sites appear in AI Overviews or ChatGPT results, well above what we've seen in other industries. AI visibility follows closely with organic performance, and brands that win in the latter tend to win in the former as well.
Brief methodology note
This report is based on 116 US supplement brand websites, pulled from Ahrefs in July 2026. It's a single snapshot in time and cannot explain trends and performance over time. Full methodology and data notes are at the end of this report.
Market Structure
The top 10 sites in this report capture 58% of all organic traffic in the sample; the top 20 capture 71%
This is a Pareto-shaped market, and individual players significantly skew the data. iHerb alone accounts for 29.2% of all traffic across all 116 sites, nearly a third of the entire sample.
| Top N sites | Share of total sample traffic |
|---|---|
| Top 1 | 29.2% |
| Top 5 | 47.5% |
| Top 10 | 57.8% |
| Top 20 | 71.3% |
| Top 30 | 81.8% |
| Top 50 | 93.0% |
A small number of outsized sites can distort raw averages in ways that don't reflect the experience of most brands in the category. We use median values instead of means throughout this report to account for that.
Authority & links
Backlink authority is the oldest and most-cited pillar of SEO strategy. The belief goes that the higher your DR, the better your chance of ranking. We put that to the test by comparing Ahrefs' domain authority metric (Domain Rating), total backlinks, and referring domains against organic traffic across all 116 domains in the sample.
Domain rating is the strongest predictor of organic traffic in the supplement industry
On the surface, DR looks like a weak predictor in our dataset. But a closer look reveals that the numbers are skewed by a handful of sites that dominate the sample. One website, iHerb, alone accounts for 29.2% of all traffic.
Once you adjust for that skew, Domain Rating comes out as the strongest predictor of organic traffic, followed closely by referring domains and backlinks.
| Metric | Raw relationship | Adjusted relationship |
|---|---|---|
| Domain Rating | Weak (0.31) | Strong (0.83) |
| Backlinks | Very strong (0.95) | Strong (0.71) |
| Referring domains | Strong (0.75) | Strong (0.80) |
Backlinks and referring domains are also strong predictors of traffic for supplement brands
We only measured backlink volume in this study, not quality. Based on our findings, the total number of backlinks strongly predicted organic traffic.
In our experience, though, link source and quality are very important. A dozen links from relevant, high-authority sites will outperform a hundred from unrelated ones.
But this isn't a direct relationship for every brand in our sample. We found that authority predicts traffic at the population level, but individual brands can deviate significantly in both directions.
Similar trends appear with underperformers: brands with a high DR have weak organic performance despite their high DR.
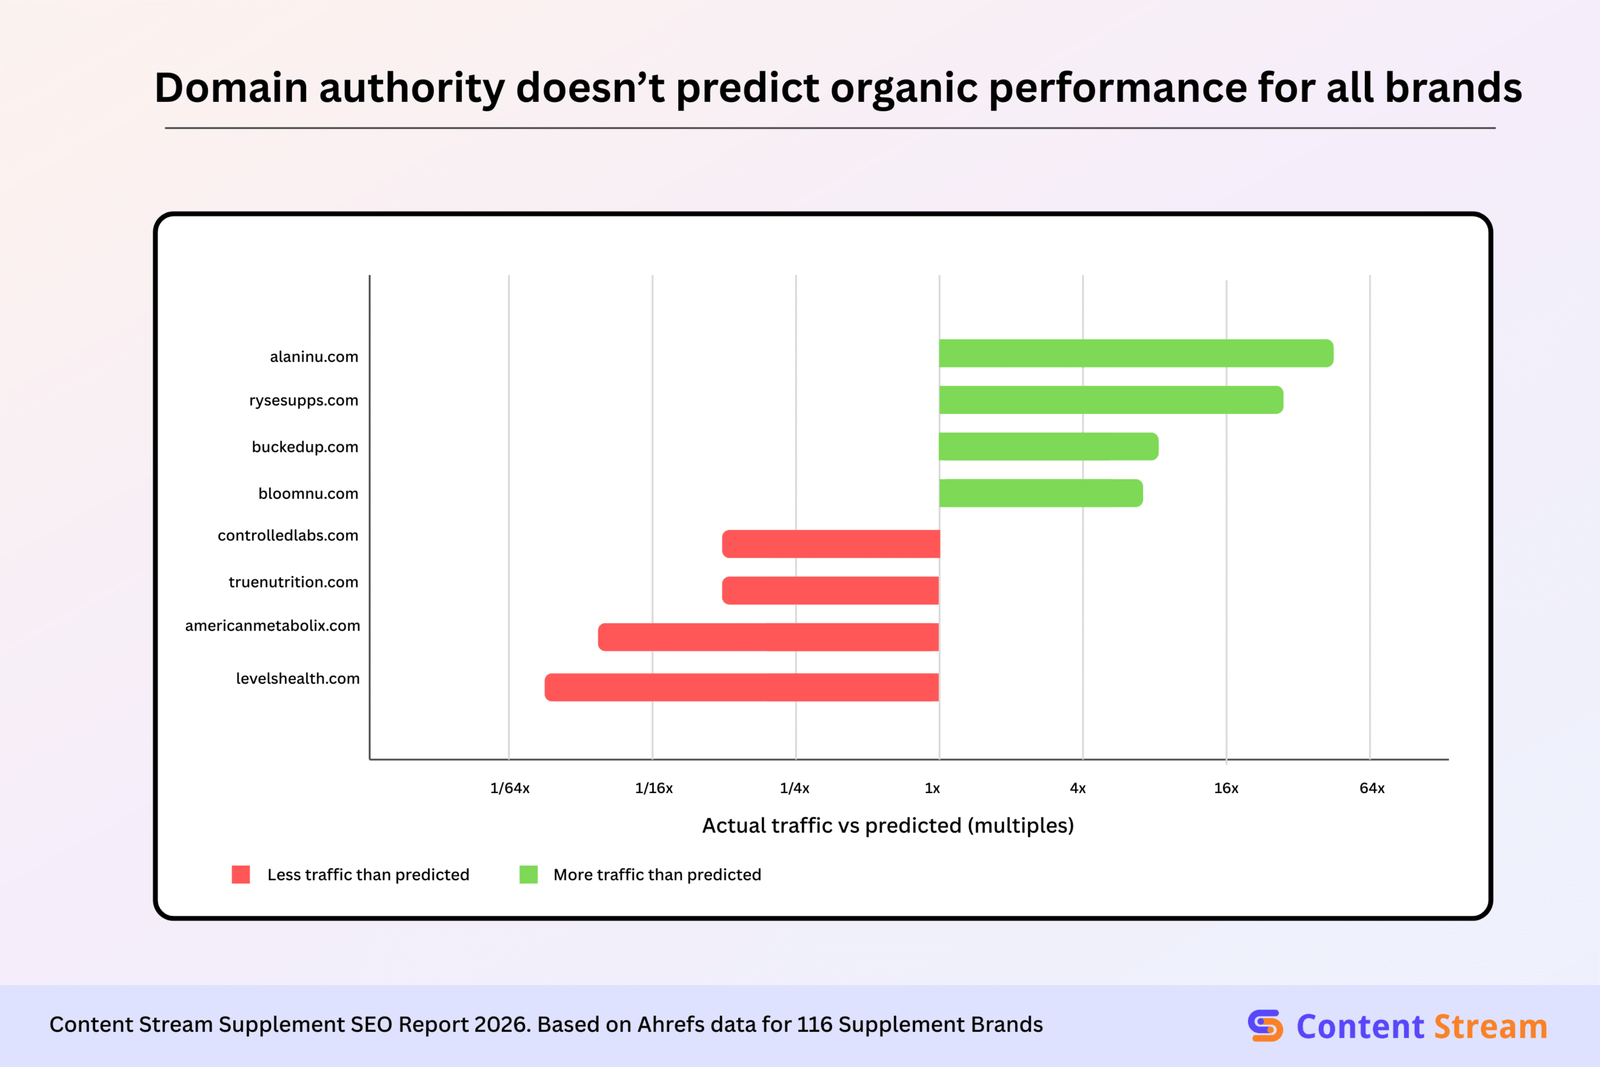
For example, “over-performers” like alaninu.com have organic traffic that’s significantly above that of any other brand in their DR range.
Key takeaway
Building domain authority over time remains the most reliable foundation for organic growth. Increasing the number of backlinks and referring domains follows closely after.
E-E-A-T & Author Signals
Our dataset contains 116 sites and dozens of uncontrolled variables, and we can't conclusively define the relationship between E-E-A-T signals and traffic based on this report. But we can confidently check for correlations and if those hold up once you account for other factors.
71% of supplement sites have author credits in their blog content
We found author attribution on most of the sites in our dataset. But these varied widely between a simple byline (By James Smith) and a fully credentialed author with an expert-review tag (By Jane Doe, RD, MSc, reviewed by Dr. Clark). Supplement content—and really, all other YMYL category content—needs a clear attribution. Google has long since stated this, and it should be standard practice at this point.
Author credentials alone don’t increase organic traffic
Sites with full author credentials have a median of 100,200 monthly visits, about 3x higher than sites with no author attribution (19,500), a bare author name (25,400), or a generic “writing team” credit (36,600).
But, looking closer, we see that 68% of those credentialed sites also belong in the top third of our sample, sorted by domain authority.
So, are these credentials actually driving traffic? Or are high-authority brands just more likely to invest in them, as well as other SEO best practices that drive organic success?
To find out, we split the sample into three authority bands and compared credentialed vs. non-credentialed sites within each. What we found was that, for the high-authority band, the traffic gap between credentialed and non-credentialed sites was only 7% (127,300 vs. 119,000 monthly visits, respectively).
| Authority tier | Credentialed (n) | Median traffic, credentialed | Non-credentialed (n) | Median traffic, non-credentialed | Gap |
|---|---|---|---|---|---|
| Low DR | 4 | 5,300 | 36 | 2,850 | sample too small |
| Mid DR | 4 | 38,650 | 34 | 38,550 | sample too small |
| High DR | 17 | 127,300 | 22 | 119,000 | 7% |
That’s not nothing, but it’s also not significant enough to say author credentials were solely responsible for their success.
Myth check: Adding author credentials will boost your organic traffic
The data doesn’t support this. Once you account for domain authority, the traffic gap between credentialed and non-credentialed sites shrinks to just 7%. The high-authority sites in our dataset perform well either way.
Key takeaway
These findings don’t make E-E-A-T irrelevant, especially for smaller brands. We recommend treating them less as a traffic driver and more as a prerequisite for competing in search.
Search Intent & Content Depth
This section answers a two-part question: what kind of content drives traffic for supplement brands? And is content still king?
Ahrefs tags each ranking keyword by intent (informational, navigational, commercial, or transactional), and a single keyword can carry more than one tag. So these figures represent keyword demand, not traffic; they don’t sum up to 100%.
Top supplement brands rank for 8.7x more keywords with only 1.3x higher DR
The top 20 highest-traffic sites have a median of 11,350 ranking keywords, with 9,050 of those appearing in the top 10. The other 96 sites average just 1,300 ranking keywords, with 993 of those in the top 10.
But when we look at the DR, we see a much smaller gap. The top sites have an average DR of 70.5 vs. just 54.0 for the others. The numbers suggest that total ranking keywords is what separate the top players from the rest, not domain authority.
Nearly every keyword supplement brands rank for carries an informational tag
Across our sample, informational keywords account for 102% of total tracked keywords, meaning informational intent was attached to nearly the entire keyword footprint, including commercial and transactional queries.
Following informational intent is commercial (58%), transactional (23%), local (3%), and navigational (under 1%). Even for queries with a clear commercial or transactional intent, we still saw them tagged informational.
This isn’t surprising for the supplement category, since buyers tend to research heavily before they buy. A single keyword can be “I want to learn about creatine” and “I’m ready to buy creatine” at the same time.
76% of supplement sites get most of their traffic from the homepage
88 of 116 sites have their homepage as the top-traffic. We see that pattern, even among the biggest sites; for 14 of the top 20 high-traffic domains, their homepage gets the most traffic of any individual page.
However, the homepage represents a smaller slice of overall traffic. Examples worth noting include iherb.com (8.7%), naturemade.com (6.2%), and gnc.com (13.7%).
Sites with the heaviest informational skew get 2.7x less traffic per keyword
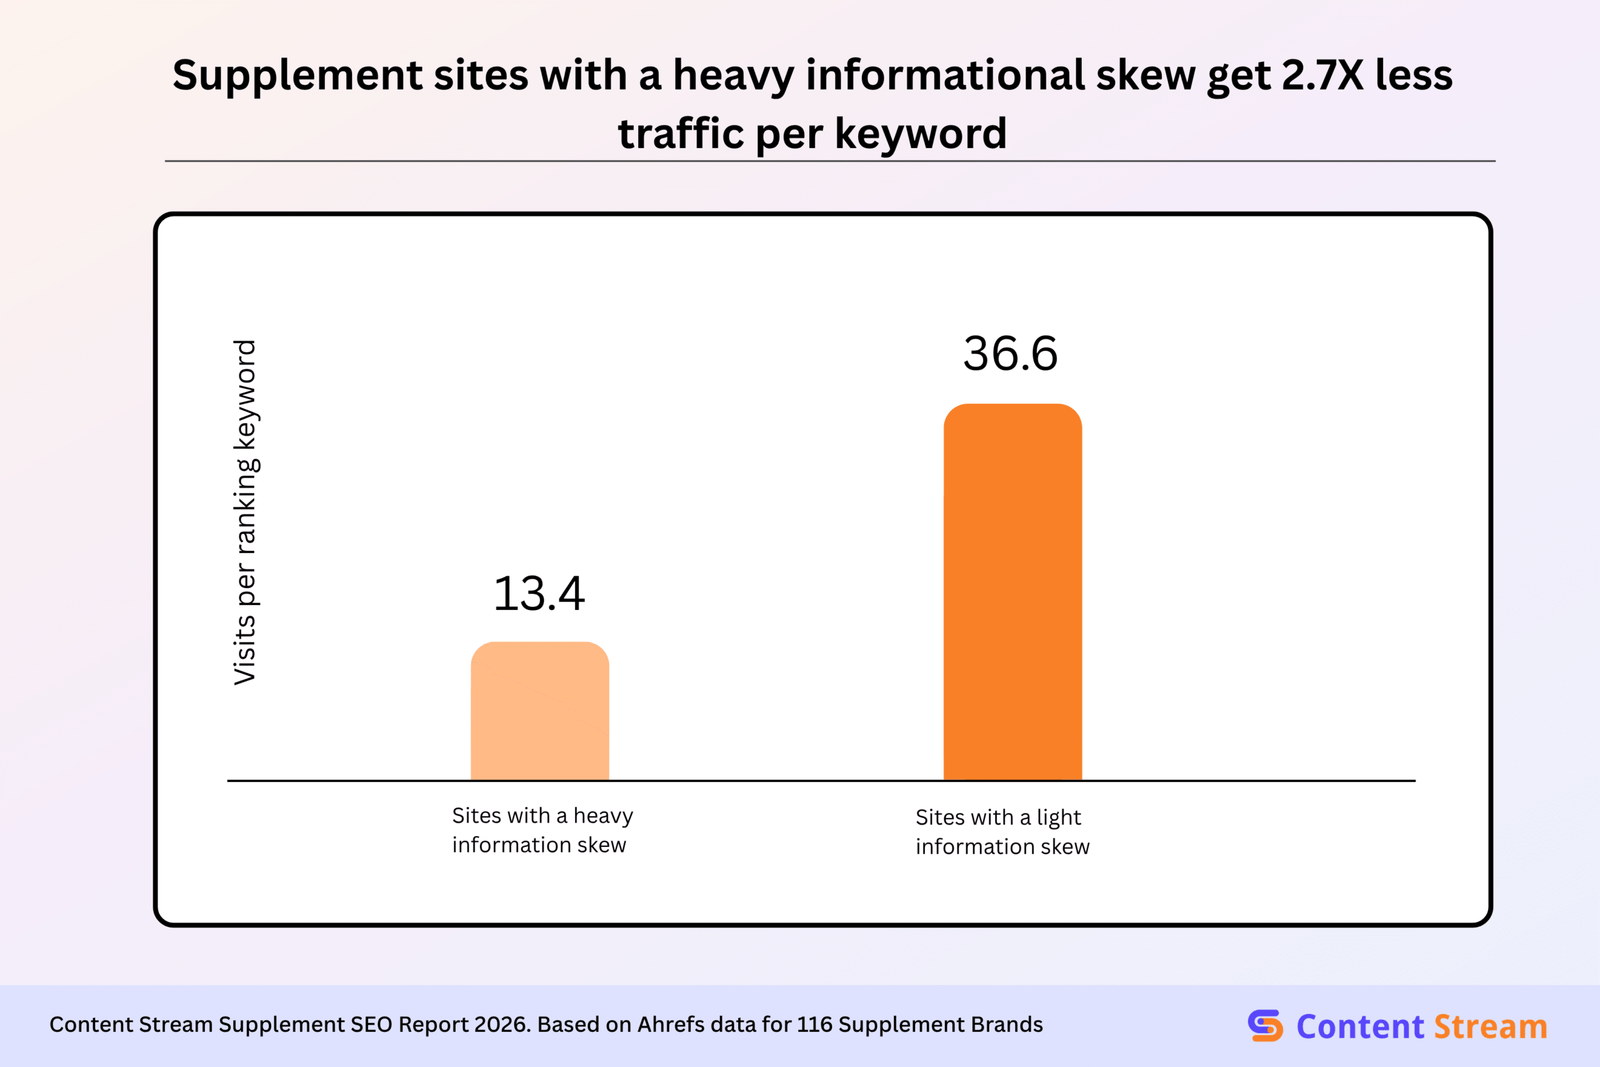
By informational skew, we mean what share of the site’s ranking keywords carry an informational intent tag – “what,” “how,” and “best for” type content. Sites with a heavy informational skew rank mostly for research queries like these, while those with a lighter skew rank for a higher number of commercial and transactional keywords.
We found that brands with the heaviest informational skew average just 13.4 visits per ranking keyword while those with a lighter skew average 36.6. The same pattern appears in the total traffic: 8,400 visits per month for the former, and 46,900 for the latter.
| Metric | Heaviest skew | Lighter skew |
|---|---|---|
| Median traffic per keyword | 13.4 | 36.6 |
| Median total traffic | 8,400 | 46,900 |
| Median total keywords | 380 | 1,800 |
| Mean Domain Rating | 48.5 | 57.4 |
Myth check: Publishing more informational content grows organic traffic.
This is false, according to our data. Sites with the heaviest informational skew get significantly less traffic per keyword and overall. The conclusion is that a balanced content mix is the best approach.
Key takeaway
These findings don’t make E-E-A-T irrelevant, especially for smaller brands. We recommend treating them less as a traffic driver and more as a prerequisite for competing in search.
Branded vs. Non-Branded Search
Non-branded traffic scales 6x faster than branded traffic as authority grows
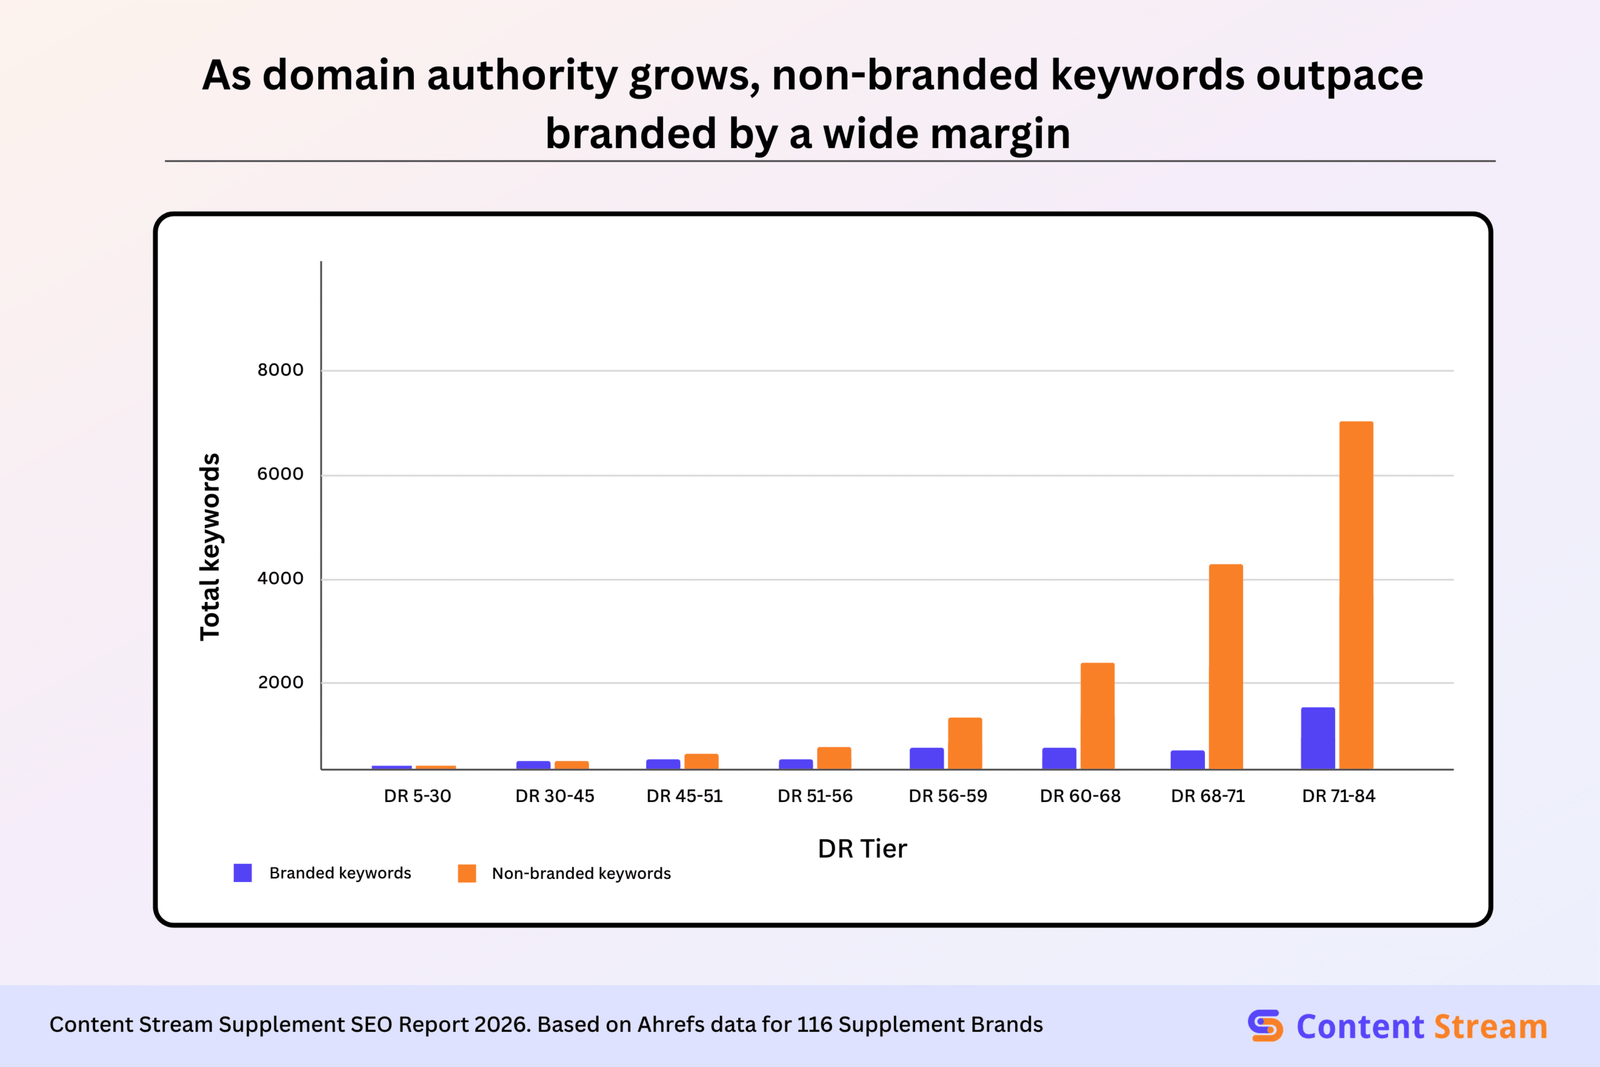
As supplement brands grow their domain authority, both branded and non-branded traffic increase. But from the data, we see that non-branded outpaces branded by 6x. Eventually, branded search shrinks as a percentage of the website’s overall keyword footprint.
The table below explains it more.
| Authority tier | Median DR | Branded keywords | Non-branded keywords | Ratio |
|---|---|---|---|---|
| DR 5–30 | 24 | 30 | 18 | 0.6x |
| DR 30–45 | 41 | 164 | 186 | 1.1x |
| DR 45–51 | 48 | 234 | 430 | 1.8x |
| DR 51–56 | 54 | 268 | 694 | 2.6x |
| DR 56–59 | 58 | 672 | 1,200 | 1.8x |
| DR 60–68 | 64 | 688 | 2,450 | 3.6x |
| DR 68–71 | 69 | 595 | 4,200 | 7.1x |
| DR 71–84 | 76 | 1,400 | 7,050 | 5.0x |
Even though the branded keywords are growing, non-branded terms quickly outpace them, and the higher the DR and the more the traffic, the greater the gap we see between branded and non-branded terms.
Note: We excluded six brands from this chart: alaninu.com, bloomnu.com, ghostlifestyle.com, gorillamind.com, buckedup.com, and redcon1.com. We cover them below.
Top supplement sites get 80% of their traffic from non-branded search
Among the 20 highest-traffic sites, branded keywords account for only 20% of their overall keyword footprint; the rest comes from non-branded keywords. Among the 20 lowest-traffic sites, branded search accounts for more than half (54%) of their overall traffic.
Note: Branded vs non-branded traffic split is very context-dependent and varies between industries. These findings only apply to supplement brands.
6 brands generate more than 9.8x traffic per page compared to peers with similar content
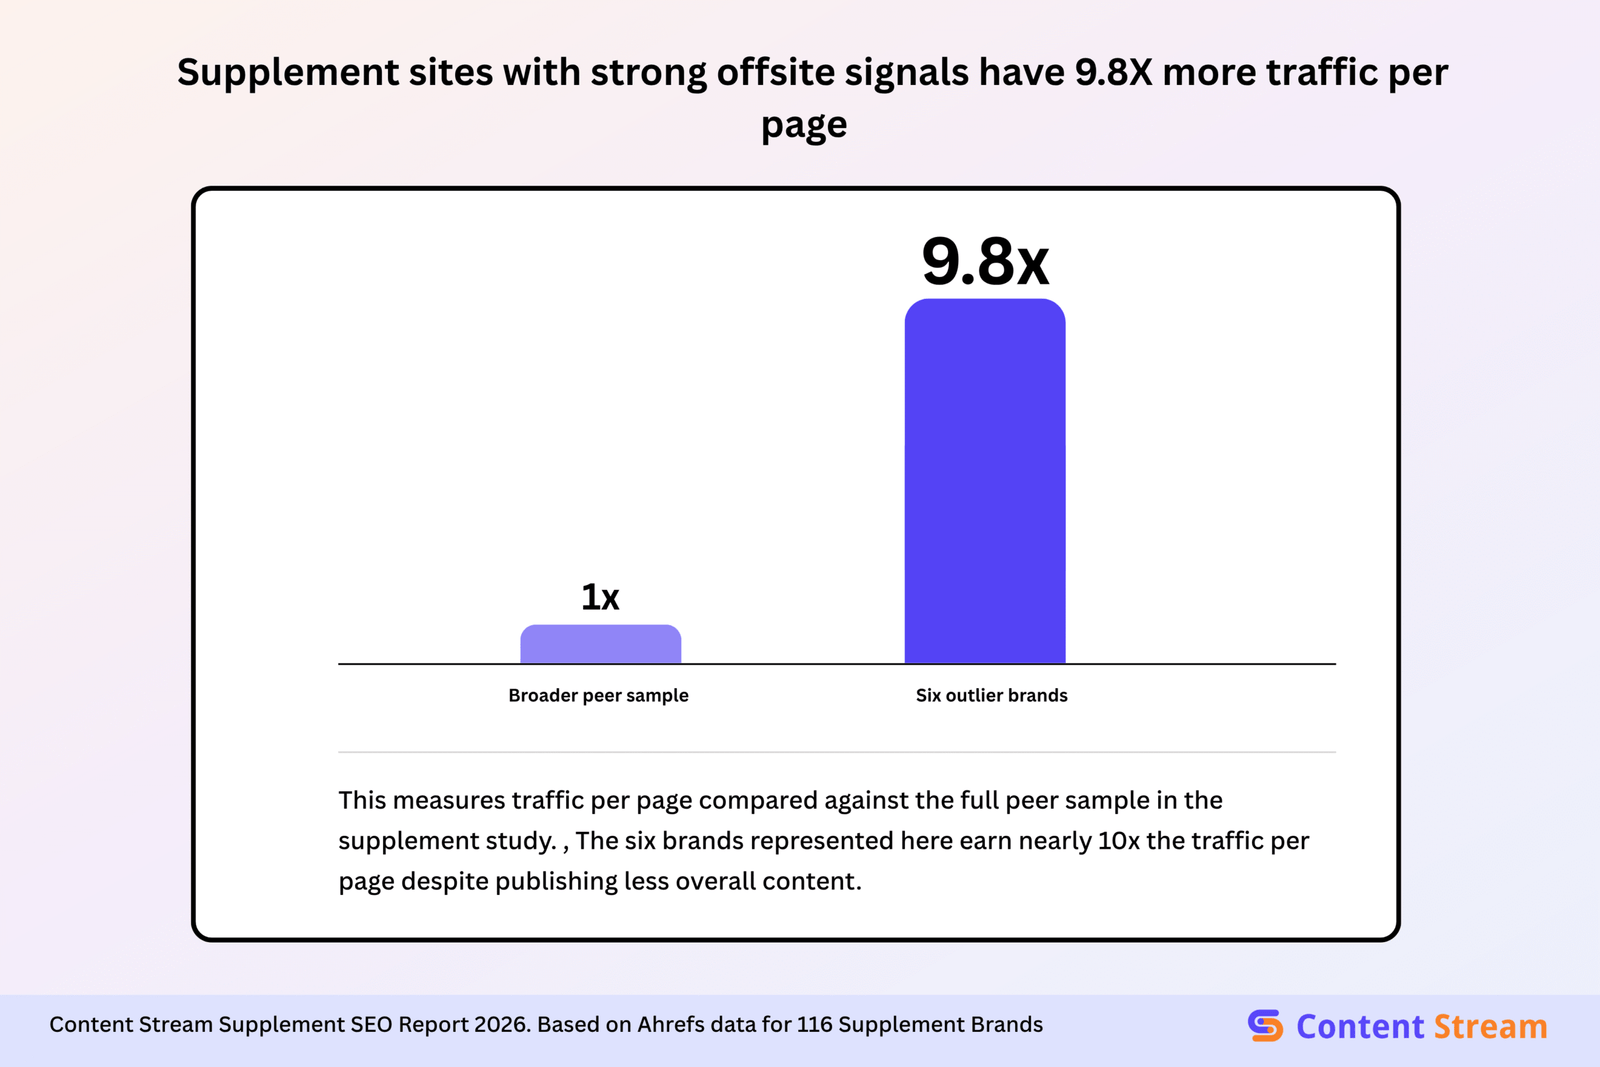
Six brands in our sample (alaninu.com, bloomnu.com, buckedup.com, gorillamind.com, ghostlifestyle.com, and redcon1.com) consistently outperform their content peers across every comparison.
Based on traffic, the six had up to 9.8x more traffic per page with significantly less content. When compared with brands with a similar content volume, they generate up to 34x as much traffic.
Our best explanation for this deviation is their offsite presence. These businesses have large social followings, influencer-backing, and founder-led personal brands. We didn’t track offsite signals directly in this report, but we’ve seen offline signals boost organic performance for businesses in the past. One instance is explored in this case study.
Myth check: A high branded traffic share is always a red flag.
It really depends on why. If your high branded traffic share is due to a weak organic presence, that’s something to fix. We see this with the smaller sites in our sample who had high branded share but low traffic. Examples include nutrabolt.com (93.3% branded, 2,700 visits) and americanmetabolix.com (100%, 25 visits). But if your high branded share is due to strong offsite signals, that’s genuinely a win.
Key takeaway
If your site has a high branded traffic dependency, you and your team need to decide why it’s happening before implementing a fix. High branded share driven by low content performance is a problem, but high branded share driven by strong offsite recognition is a win.
Technical Health: Redirects and 404s
The typical supplement site has more 404 errors and redirects than indexed pages
The typical site in our sample has 1.24 404s per organic page (median), and the biggest sites go as high as 45 404s per organic page.
With redirects, we see a similar pattern, with the typical site having 2.92 redirects per indexed page. Overall, 81.6% of supplement sites have more redirects than pages.
This isn’t surprising because supplement brands deal with fast SKU turnover, limited-time drops, and seasonal campaigns. Each one of these is a potential source of a broken URL or redirect.
Myth check: High 404 and redirect rates hurt organic performance for supplement brands.
This is false, according to the data. Within the same traffic bands, 404 and redirect rates vary widely with no clear relationship with organic performance. This kind of technical debt does not seem to affect traffic one way or another.
Key takeaway
Most supplement SEO guides will tell you to clean up your 404s and redirects. Our data says otherwise. All 116 sites we evaluated carry significant technical debt, and it doesn’t appear to cost them anything in organic performance.
Paid vs. Organic Strategy
This section covers only the 85 sample brands that show any paid search activity in Ahrefs. Brands with zero paid presence are excluded entirely.
Note: Ahrefs’ paid figures are modelled estimates, not verified ad spend. As a result, we have to treat these as directional figures rather than precise ones. Additionally, we are an SEO agency, and so, we can’t speak direclty to these brands’ PPC strategies.
Organic leaders spend more than 2x on paid ads than the average brand
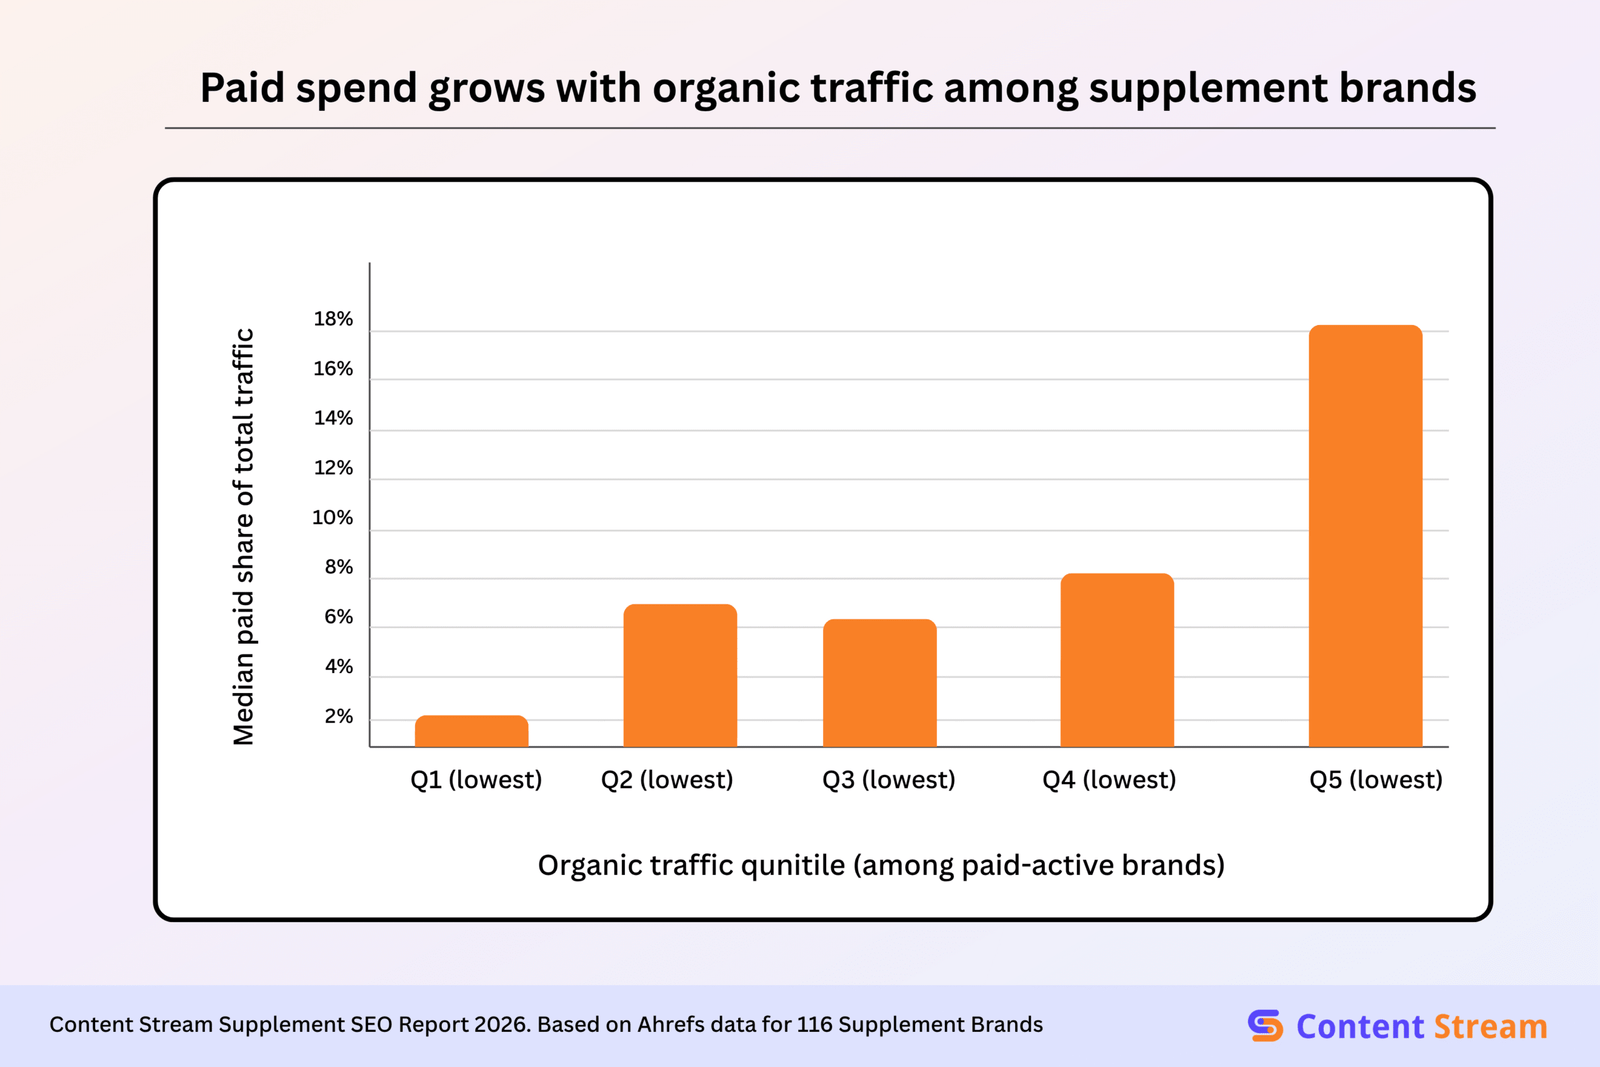
Among the brands that run paid ads in our dataset, the median site gets about 6.6% of its total traffic from paid. But for the top 20 organic performers, 13.6% of their total traffic comes from paid. That’s more than double the typical brand.
The bottom 20 sites had the weakest paid footprint, at just 1.8% of total organic traffic.
Each bar groups brands active in paid into 5 segments by organic traffic, low to high. We see the paid share climbing with total traffic.
| Quintile | Organic traffic range | n | Median organic traffic | Median paid traffic | Paid : organic ratio |
|---|---|---|---|---|---|
| Q1 | 836 – 13,000 | 17 | 4,500 | 47 | 1.00% |
| Q2 | 14,500 – 29,100 | 17 | 23,900 | 1,500 | 6.30% |
| Q3 | 29,700 – 68,300 | 17 | 46,600 | 2,900 | 6.20% |
| Q4 | 69,300 – 149,000 | 17 | 117,600 | 9,600 | 8.20% |
| Q5 | 150,200 – 3,600,000 | 17 | 199,300 | 37,900 | 19.00% |
Myth check: Winning at organic search reduces a supplement brand’s need for paid ads.
We see that the brands performing best organically are also spending the most on paid ads. Among brands that advertise, the top 20 organic performers get 13.6% of their traffic from paid, more than double the typical site’s. This shows that organic success and paid spend grow together, and they don’t replace one another.
Key takeaway
If you’re waiting for your organic traffic to get strong enough to pull back on paid, the data suggests that moment may never come. The biggest supplement brands treat both channels as a big part of their overall strategy.
AI Search Visibility
97% of supplement brands appear in AI search results
AI citations are often hard-won positions reserved for the highest-traffic players in any niche. But in this sample, nearly every brand shows up in both Google’s AIO and ChatGPT results. Only 3 out of 116 sites don’t appear in either at all.
That’s a striking contrast to other industries. In our recent report on Employee Assistance Program providers, only 35% of brands appeared in AI Overviews.
We think content type is the most likely explanation for this. Supplement brands rank for everyday queries—ingredients, dosages, product comparisons—that buyers in the awareness stage will ask AI chatbots.
Since supplement brands tend to have a wider, more conversational keyword footprint, they have a wider surface area for AI citations.
Higher organic traffic strongly predicts AI visibility
It should come as no surprise that the brands with the most AI citations also have the most organic traffic in our dataset.
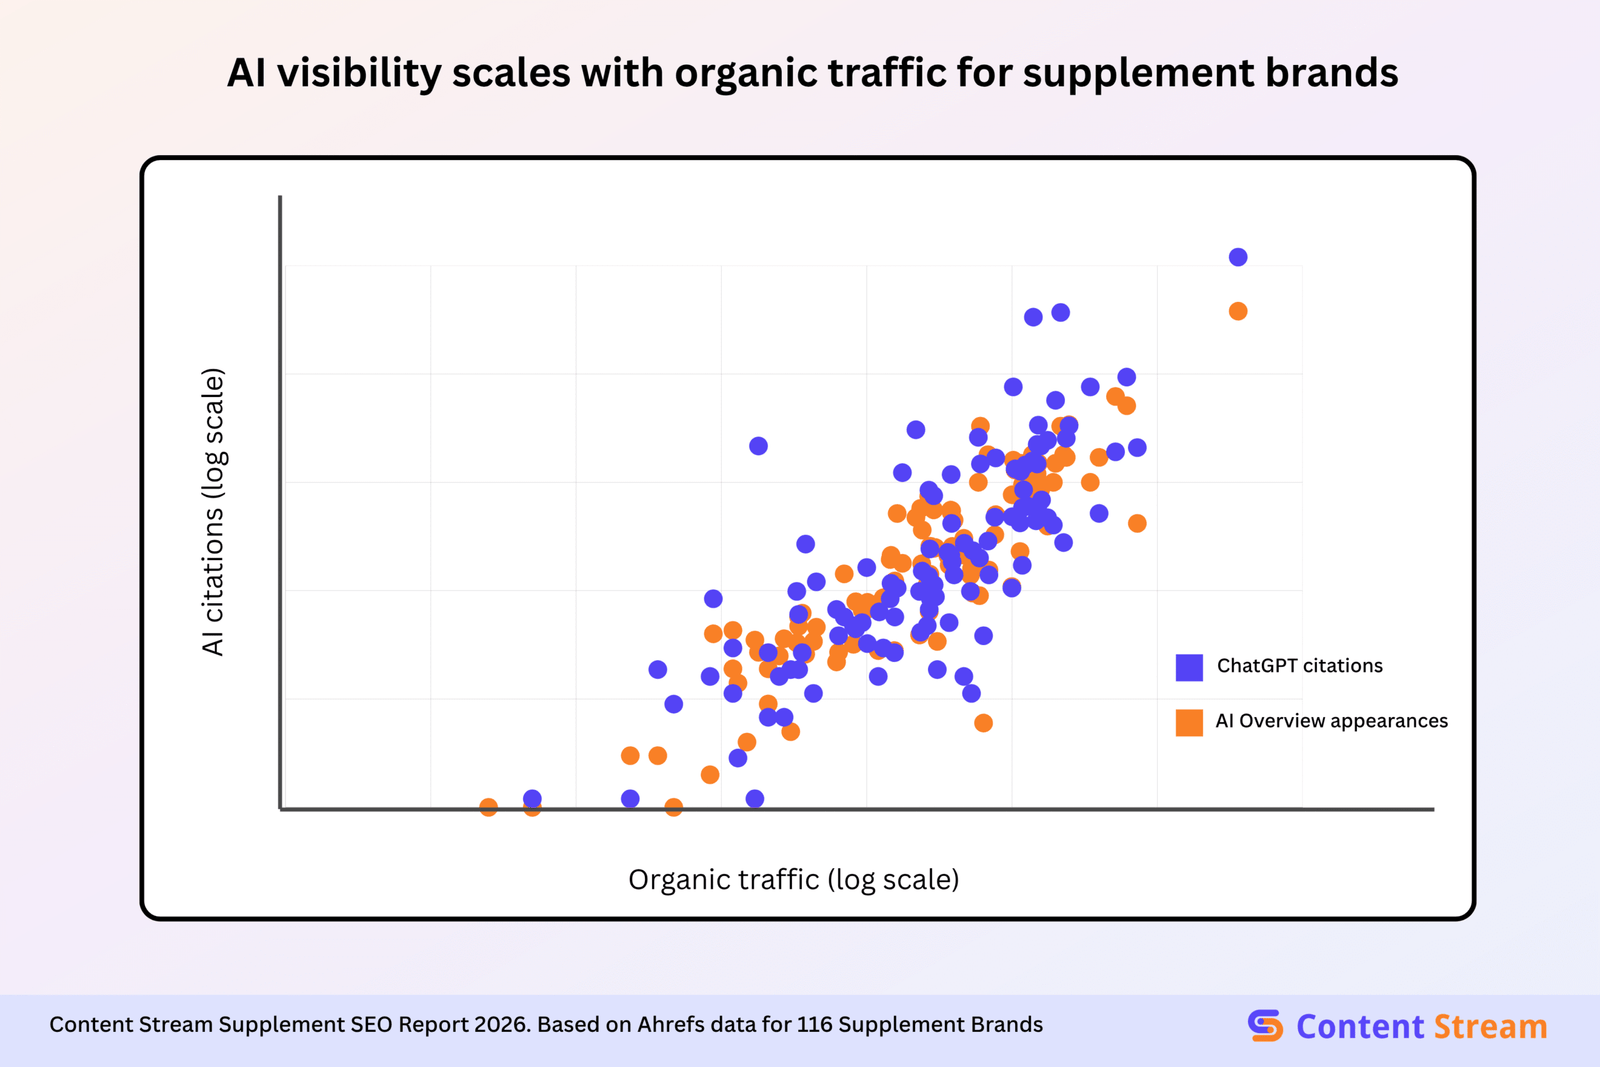
Above is a scatter plot showing the relationship between organic traffic and AI Overview appearances for every supplement brand in our report. We see the relationship holding true with both Google’s AI overviews and ChatGPT results.
Myth check: Supplement brands need a dedicated AI search strategy to show up in AI results.
This is false, according to the data. AI visibility in this category correlates strongly with organic performance, and brands that perform in search also tend to win in AI citations. The best approach remains strong SEO fundamentals and quality content.
Key takeaway
For supplement brands, AI visibility is a result of good SEO strategy, and brands don’t need a separate strategy. If you’re ranking well organically, you’re likely already showing up in AI results.
Methodology & Data Notes
The sample
The report consists of 116 US supplement brand websites, ranging from large retailers, DTC challenger brands, and established supplement manufacturers. The data was pulled from Ahrefs in July 2026.
Keyword tagging accuracy
Ahrefs’ branded/non-branded tagging isn’t always accurate. To ensure our deductions were clean, we tested the tags against live keyword data for 8 sample brands and found that about 13% of clearly branded keywords were misclassified. Most of these were for brands with generic names (like bulk.com) or a large number of product variants (like alaninu.com). We avoided drawing precise conclusions about individual brands where the tagging was unreliable.
We also considered, but ended up declining to use, homepage traffic as a proxy for branded traffic since the relationship varied too much between brands.
Small data anomalies
Two sites show an organic page count of 1, likely a data error. Both were excluded from any page-normalised calculations. The four keyword-position buckets also sum to roughly 8% higher than total keyword counts; this is based on how Ahrefs tags keywords and was addressed in the relevant section.
What we left out
We didn’t cover geography or local search, since the sample was built around US brands. Paid search figures are modelled Ahrefs estimates, not verified ad spend, so that section sticks to directional patterns only.